
REPORTS & ANALYTICS
Event analytics and reporting across multiple events
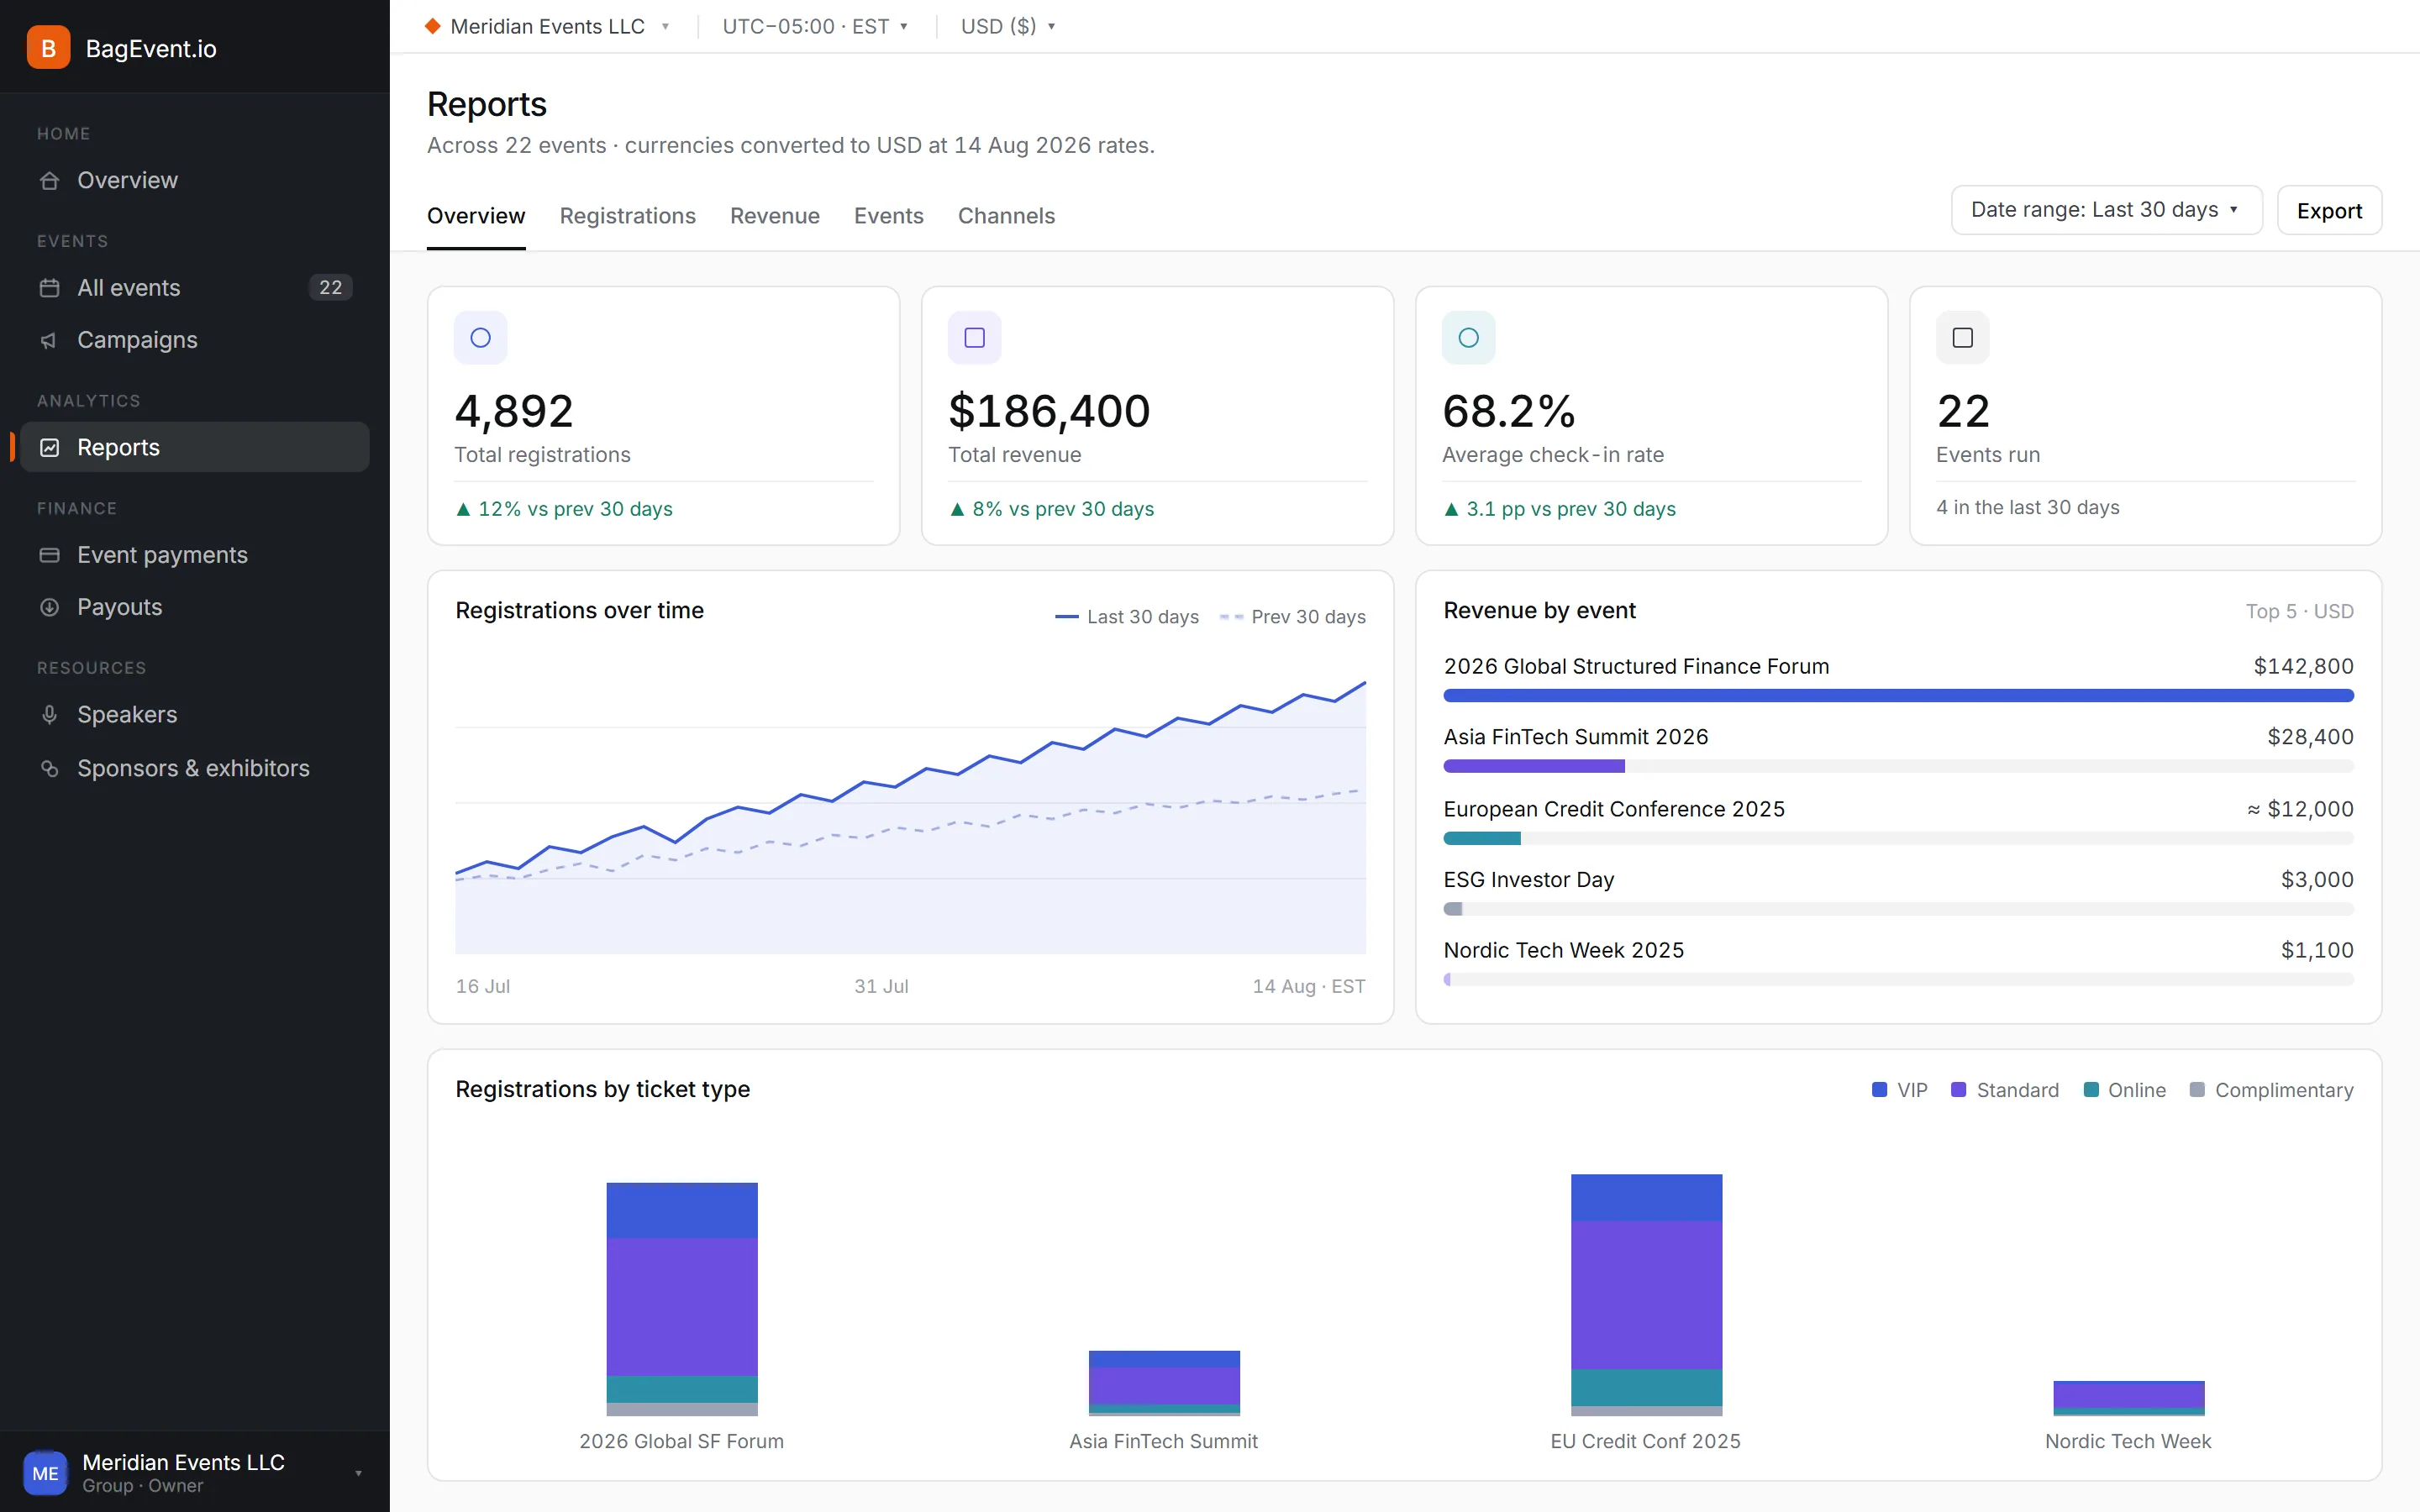
Key features
Registration reports
See daily, weekly, and cumulative registration trends for any event. The curve makes it obvious whether a campaign moved the needle or the event is tracking flat.
Revenue breakdown
Split revenue by ticket type, currency, and legal entity. Multi-entity organizations get figures per entity without exporting and reconciling by hand.
Channel attribution
Find out which partners, campaigns, and referrers actually drive signups rather than just traffic. Available on Business and Enterprise.
Event comparison
Put events side by side to compare registration pace, revenue, and show rate. Useful for judging this year's edition against last year's.
Real-time dashboards
During a live event, numbers update as orders and check-ins come in. No refresh cycle or overnight batch to wait for.
Export
Export any report for use in your own tooling. CSV export is on every plan; PDF export is on Business and Enterprise.
How it works
- 1
Collect automatically
Registration, payment, and check-in data flow into reports with no setup.
- 2
Compare across events
Line up events side by side to see which formats and channels perform.
- 3
Export and share
Send figures to finance or leadership in the format they already use.
Frequently asked questions
Yes, on Business and Enterprise plans. Cross-event reports aggregate registrations, revenue, and attendance across your whole portfolio rather than one event at a time.
Channel attribution tags each registration with its referrer, campaign, or partner link, so you can compare signups rather than raw traffic. Available on Business and Enterprise.
Yes. CSV export is available on every plan. PDF export, formatted for sharing with stakeholders, is available on Business and Enterprise.
Yes. Registration, payment, and check-in figures update as events happen, so dashboards are usable while an event is running rather than only afterwards.
Yes. If you settle through multiple entities, revenue reports split by entity and currency so each one reconciles independently.
Show rate is the share of registered attendees who actually checked in. It is calculated automatically from check-in data and is a core measure of how well an event converted interest into attendance.
0% platform fee on every plan — from $99 a month billed annually, with a 14-day free trial, no credit card, fair use on paid tickets (50 registrations / $500).
See pricingReady to run your next event?
Get started in minutes — or try the live demo to see what your attendees get.
- No credit card required
- GDPR-ready
- Multi-currency